Project Hours Overview
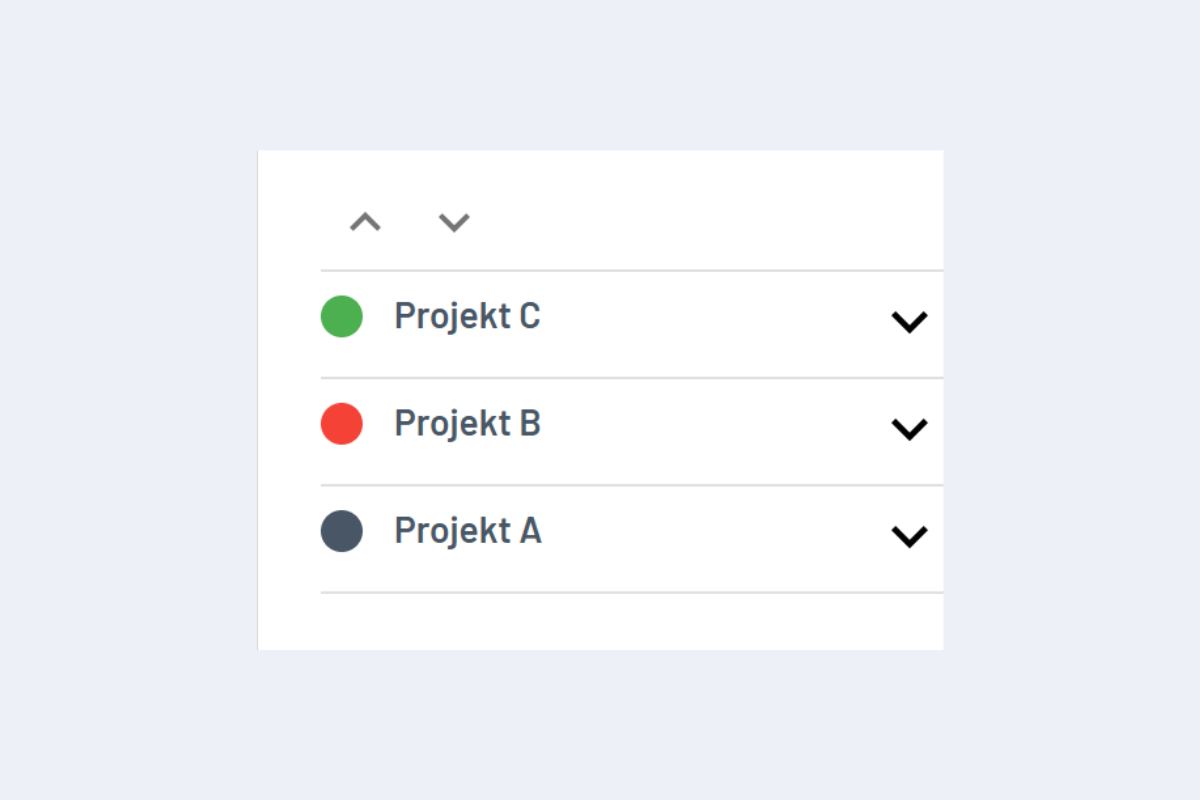
With planr, the actual project hours are compared with the forecast and thus verified. In the Project View, a colored dot (green, red, gray) indicates the current status of the hours overview (see Fig. Hours Overview). Clicking on it opens a window with further details.
- Green Dot: Actual hours are below the forecast.
- Red Dot: Actual hours exceed the forecast.
- Gray Dot: No forecast has been entered, therefore no target/actual comparison is possible.
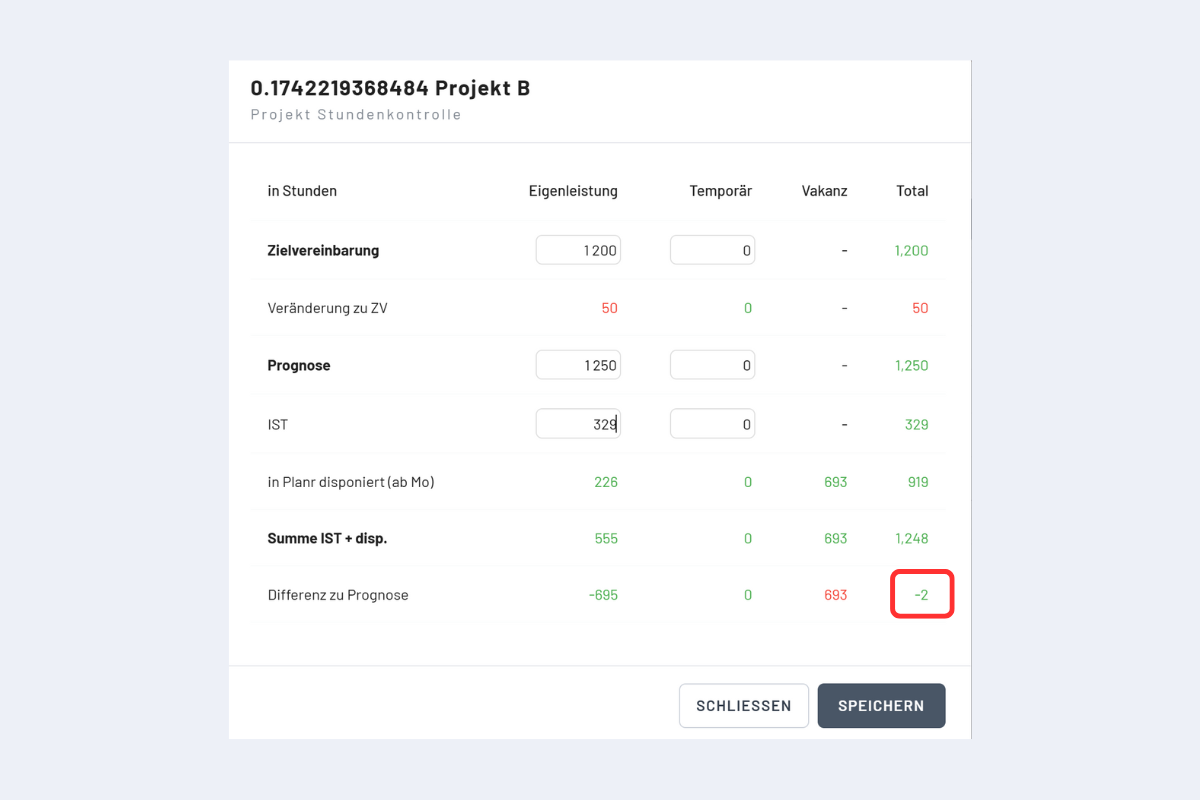
The overview (see Fig. Hours Overview Details) shows, broken down by Own Effort, Temporary, Vacancy, and Total Hours:
- The hours calculated in the Target Agreement.
- The Change to TA between forecast and target agreement.
- The hours currently entered in the Forecast.
- The Actual Hours are those hours that lie in the past and have thus already been performed (must be manually adjusted).
- The Scheduled in planr (from Mon) are those hours that are scheduled and still to be performed (at least partially, as it includes all hours from Monday of the current week and can thus also lie in the short-term past).
- The Sum Actual + Sched. the total hours performed (Actual) and planned (scheduled) for the entire project.
- The Difference to Forecast shows the corresponding difference.
The number outlined in red shows the relevant key figure for controlling project hours.