Fundamentals, Display & Interpretation
Regardless of whether the utilization chart is opened in the employee view, project view, or service view – the utilization figures are always based on the employees and are identical in all views.
A basic requirement for a realistic utilization display is defining the working hours in the settings before starting with planning. We recommend not storing working hours for Saturday and Sunday if work is not regularly performed on these days. Otherwise, there may be deviations in utilization values between the yearly view and the other views (day, week, month).
If the company regularly works on Saturday, for example, working hours should also be stored for this day so that utilization is calculated correctly.
Display Utilization Control in the First Line
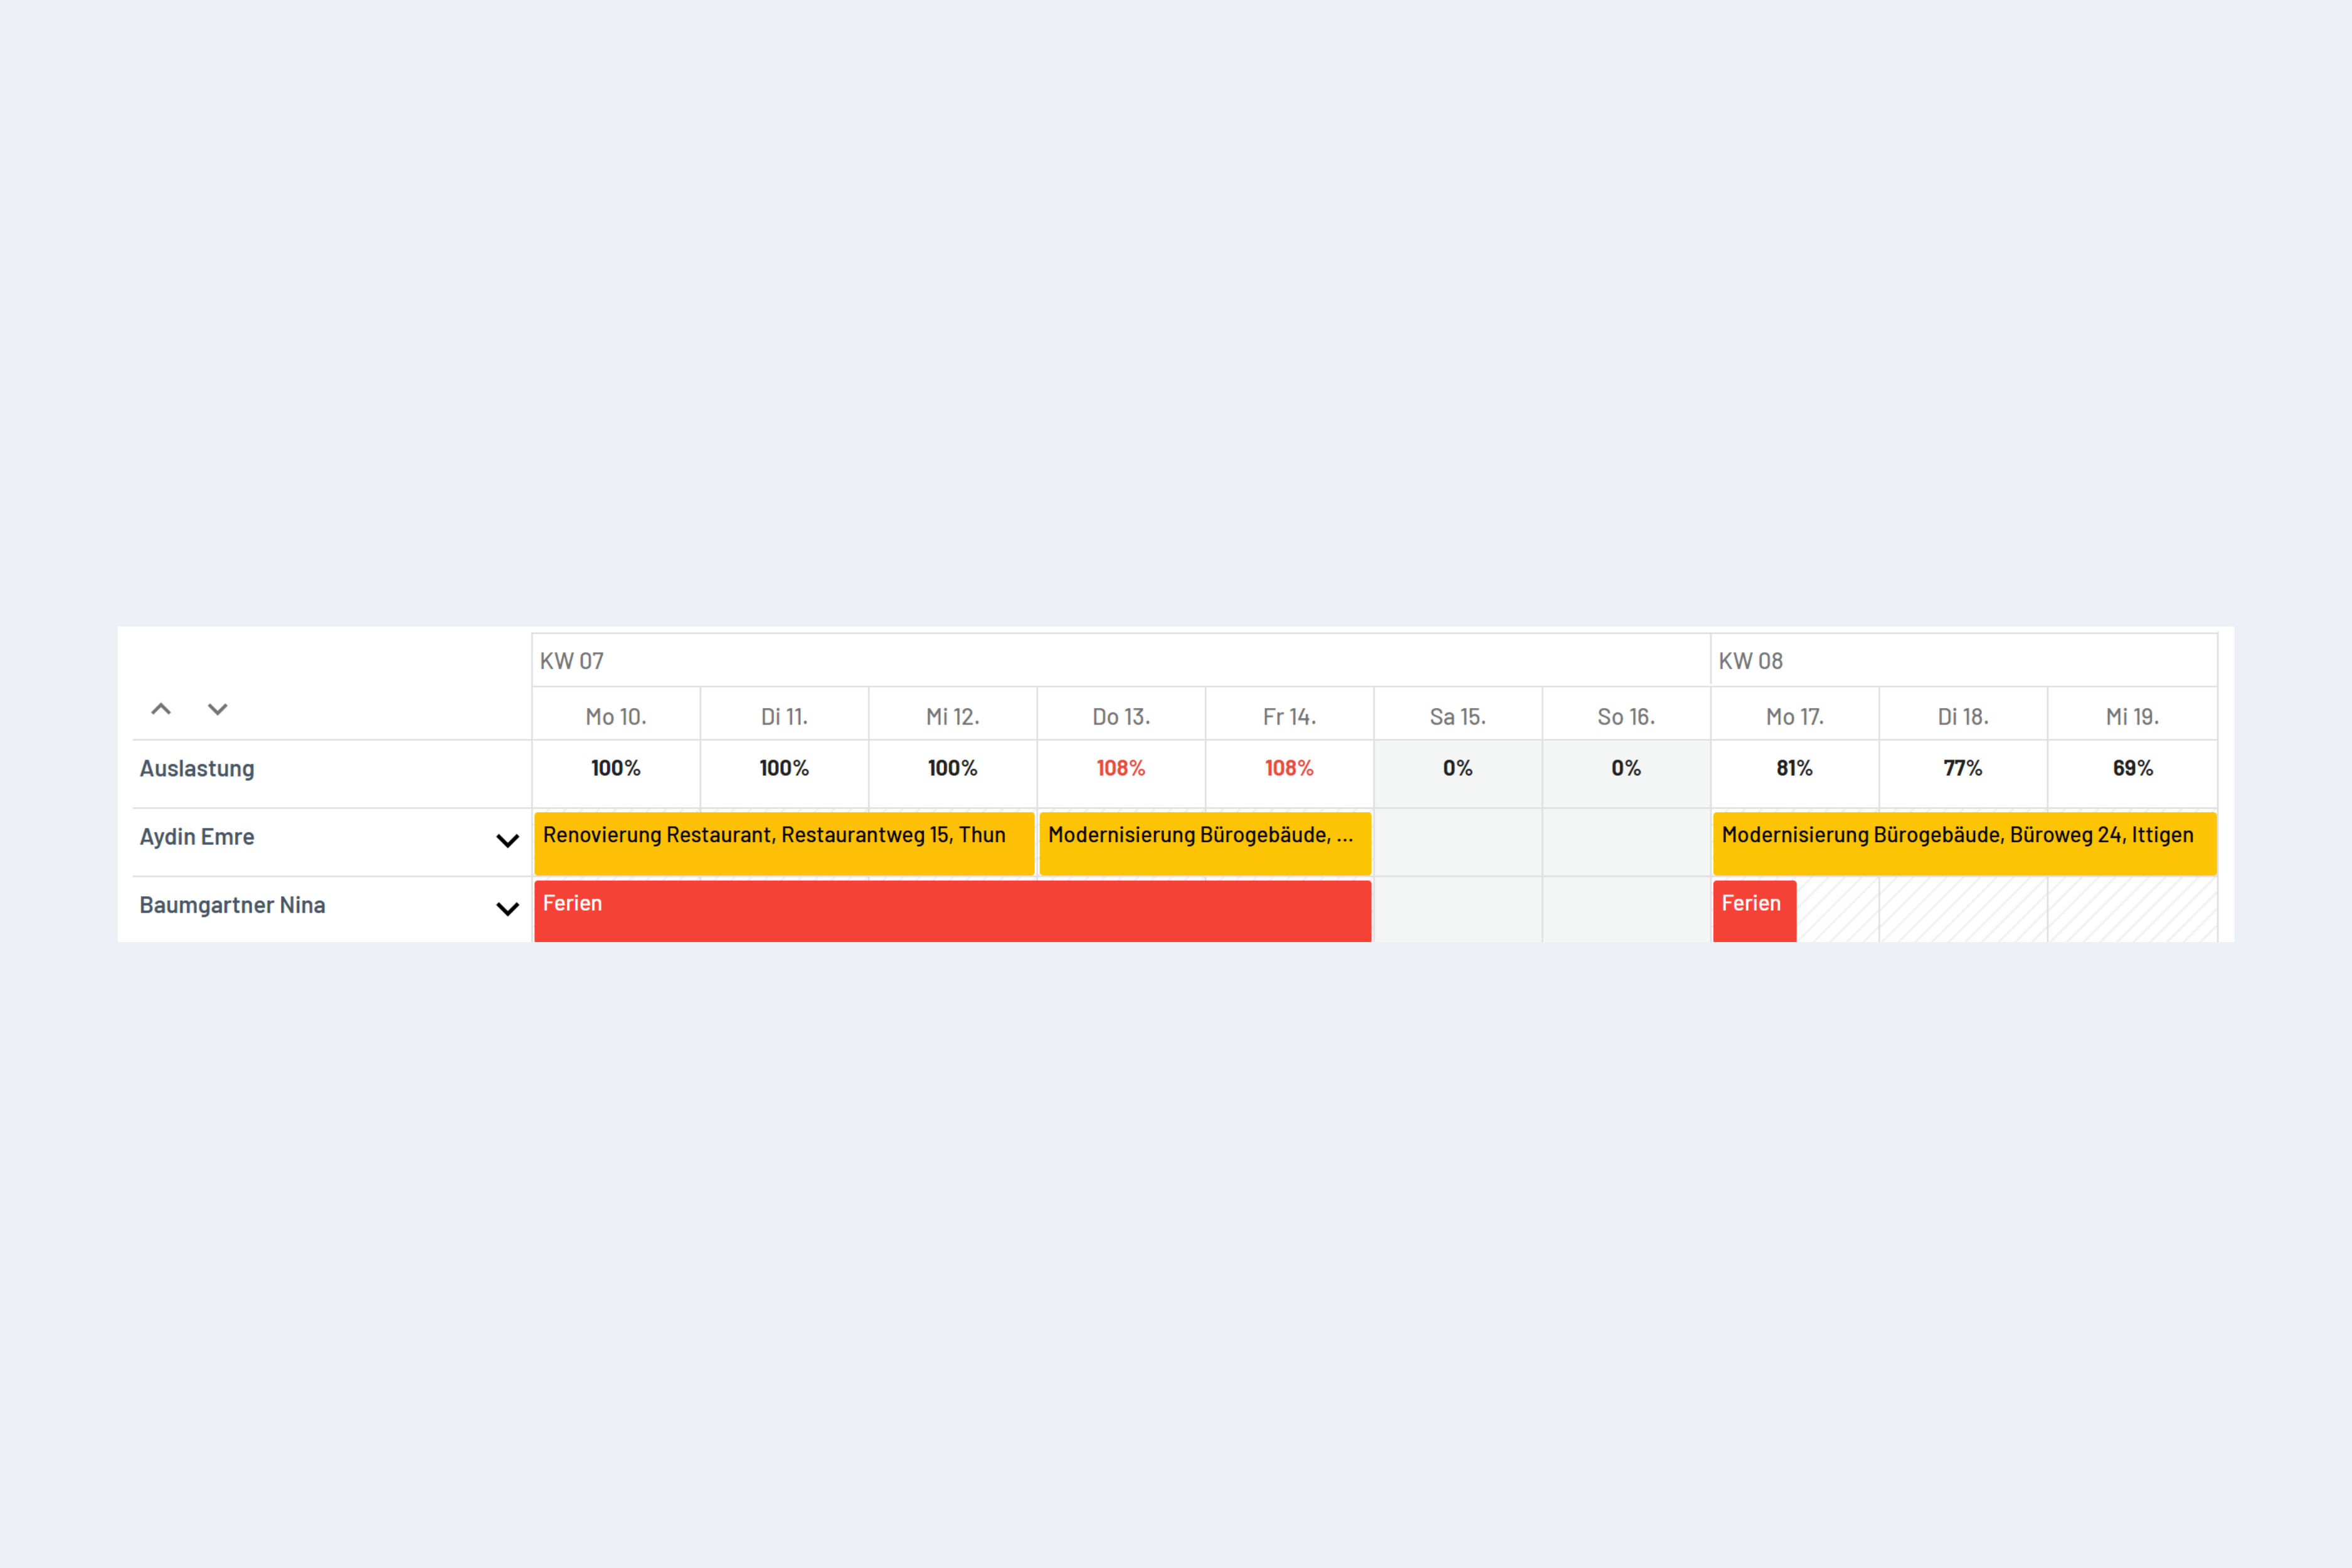
In the employee, project, and service views, the workforce utilization can be displayed in the top line (see Fig. Utilization in the top line).
When this option is activated, the loading time may be slightly extended since the utilization for the selected time period must first be calculated.
Utilization in the top line
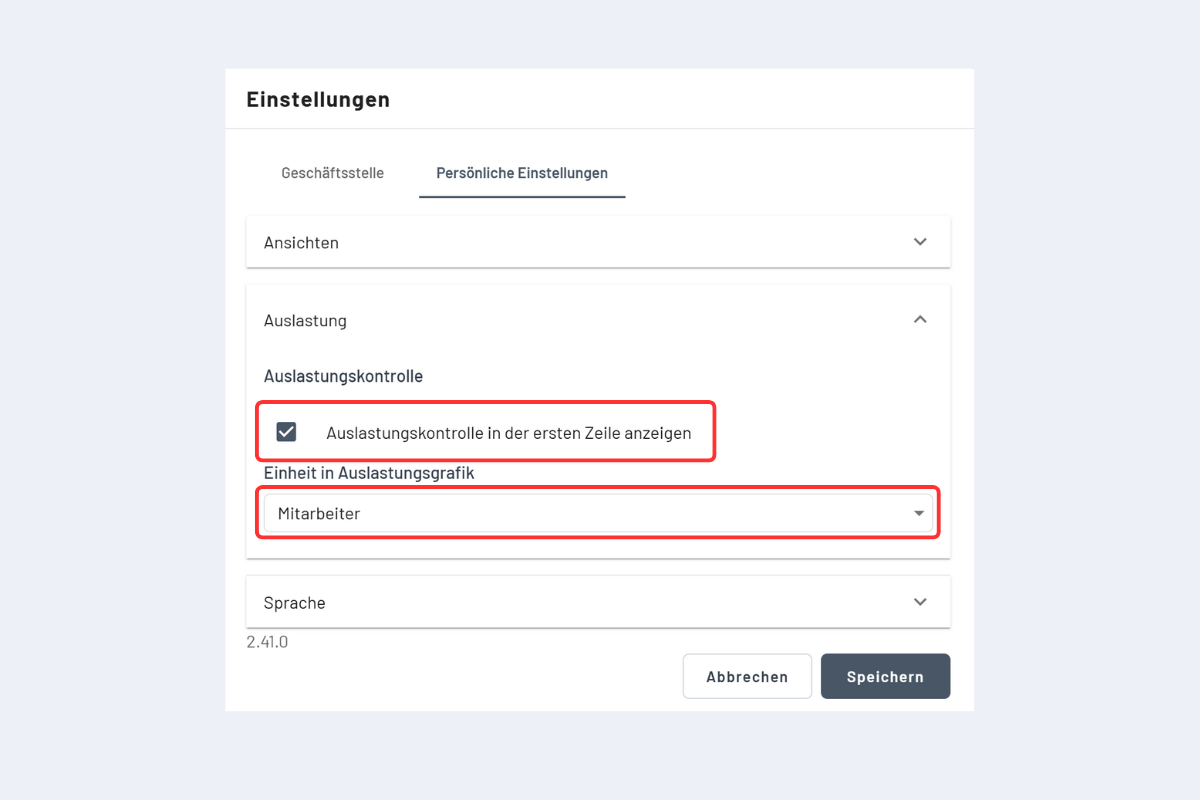
This option can be turned on or off in the Settings under the Personal Settings tab (see Fig. Utilization Control Settings). This function is limited to the weekly, monthly, and yearly views.
Utilization Control Settings
Utilization Chart
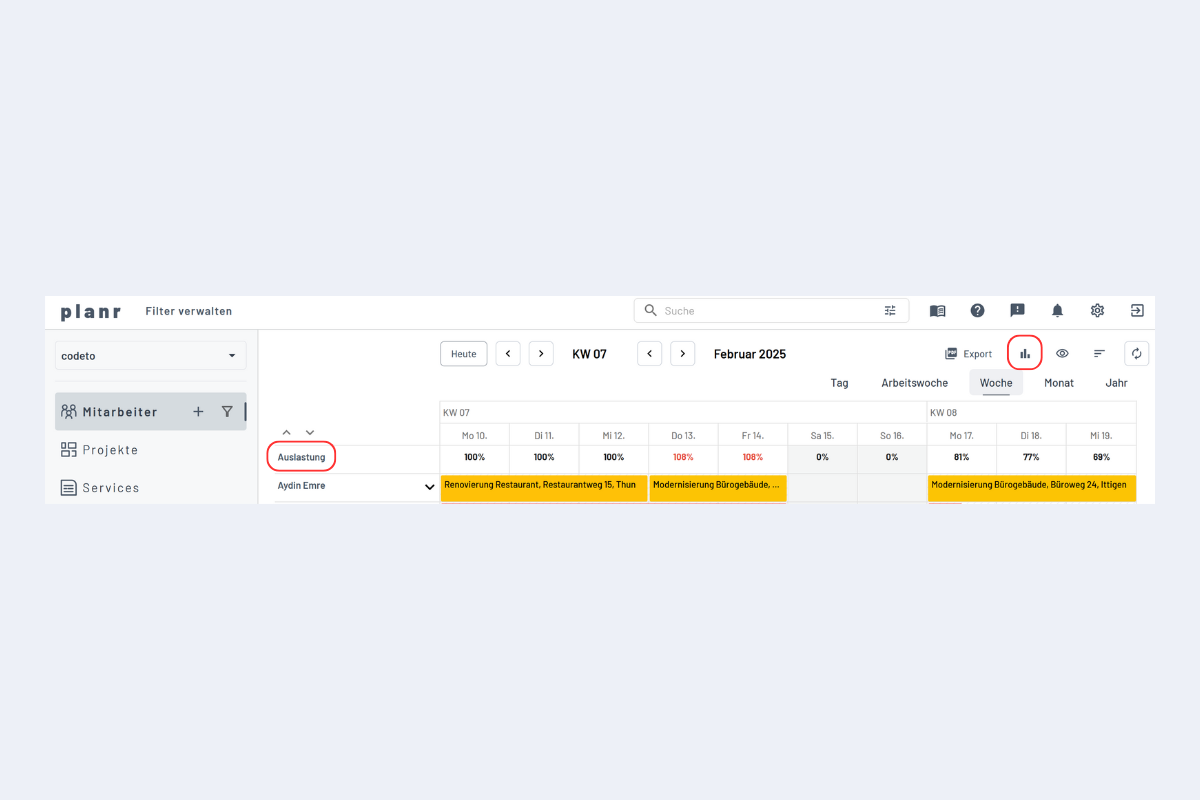
There are two ways to get a detailed insight into utilization, called Utilization Chart (see Fig. Open Utilization Chart). The utilization control is displayed for the time span (day, week, month, or year) selected in the current calendar view (exception: in the work week view, utilization is displayed in the weekly view).
In the utilization chart, Saturday and Sunday are generally not displayed – even if there are bookings for these days. This serves better clarity and prevents gaps in the display.
Open Detailed Utilization Control
When either option is clicked, the utilization chart opens (see Fig. Utilization Chart Overview).
Utilization Chart Overview
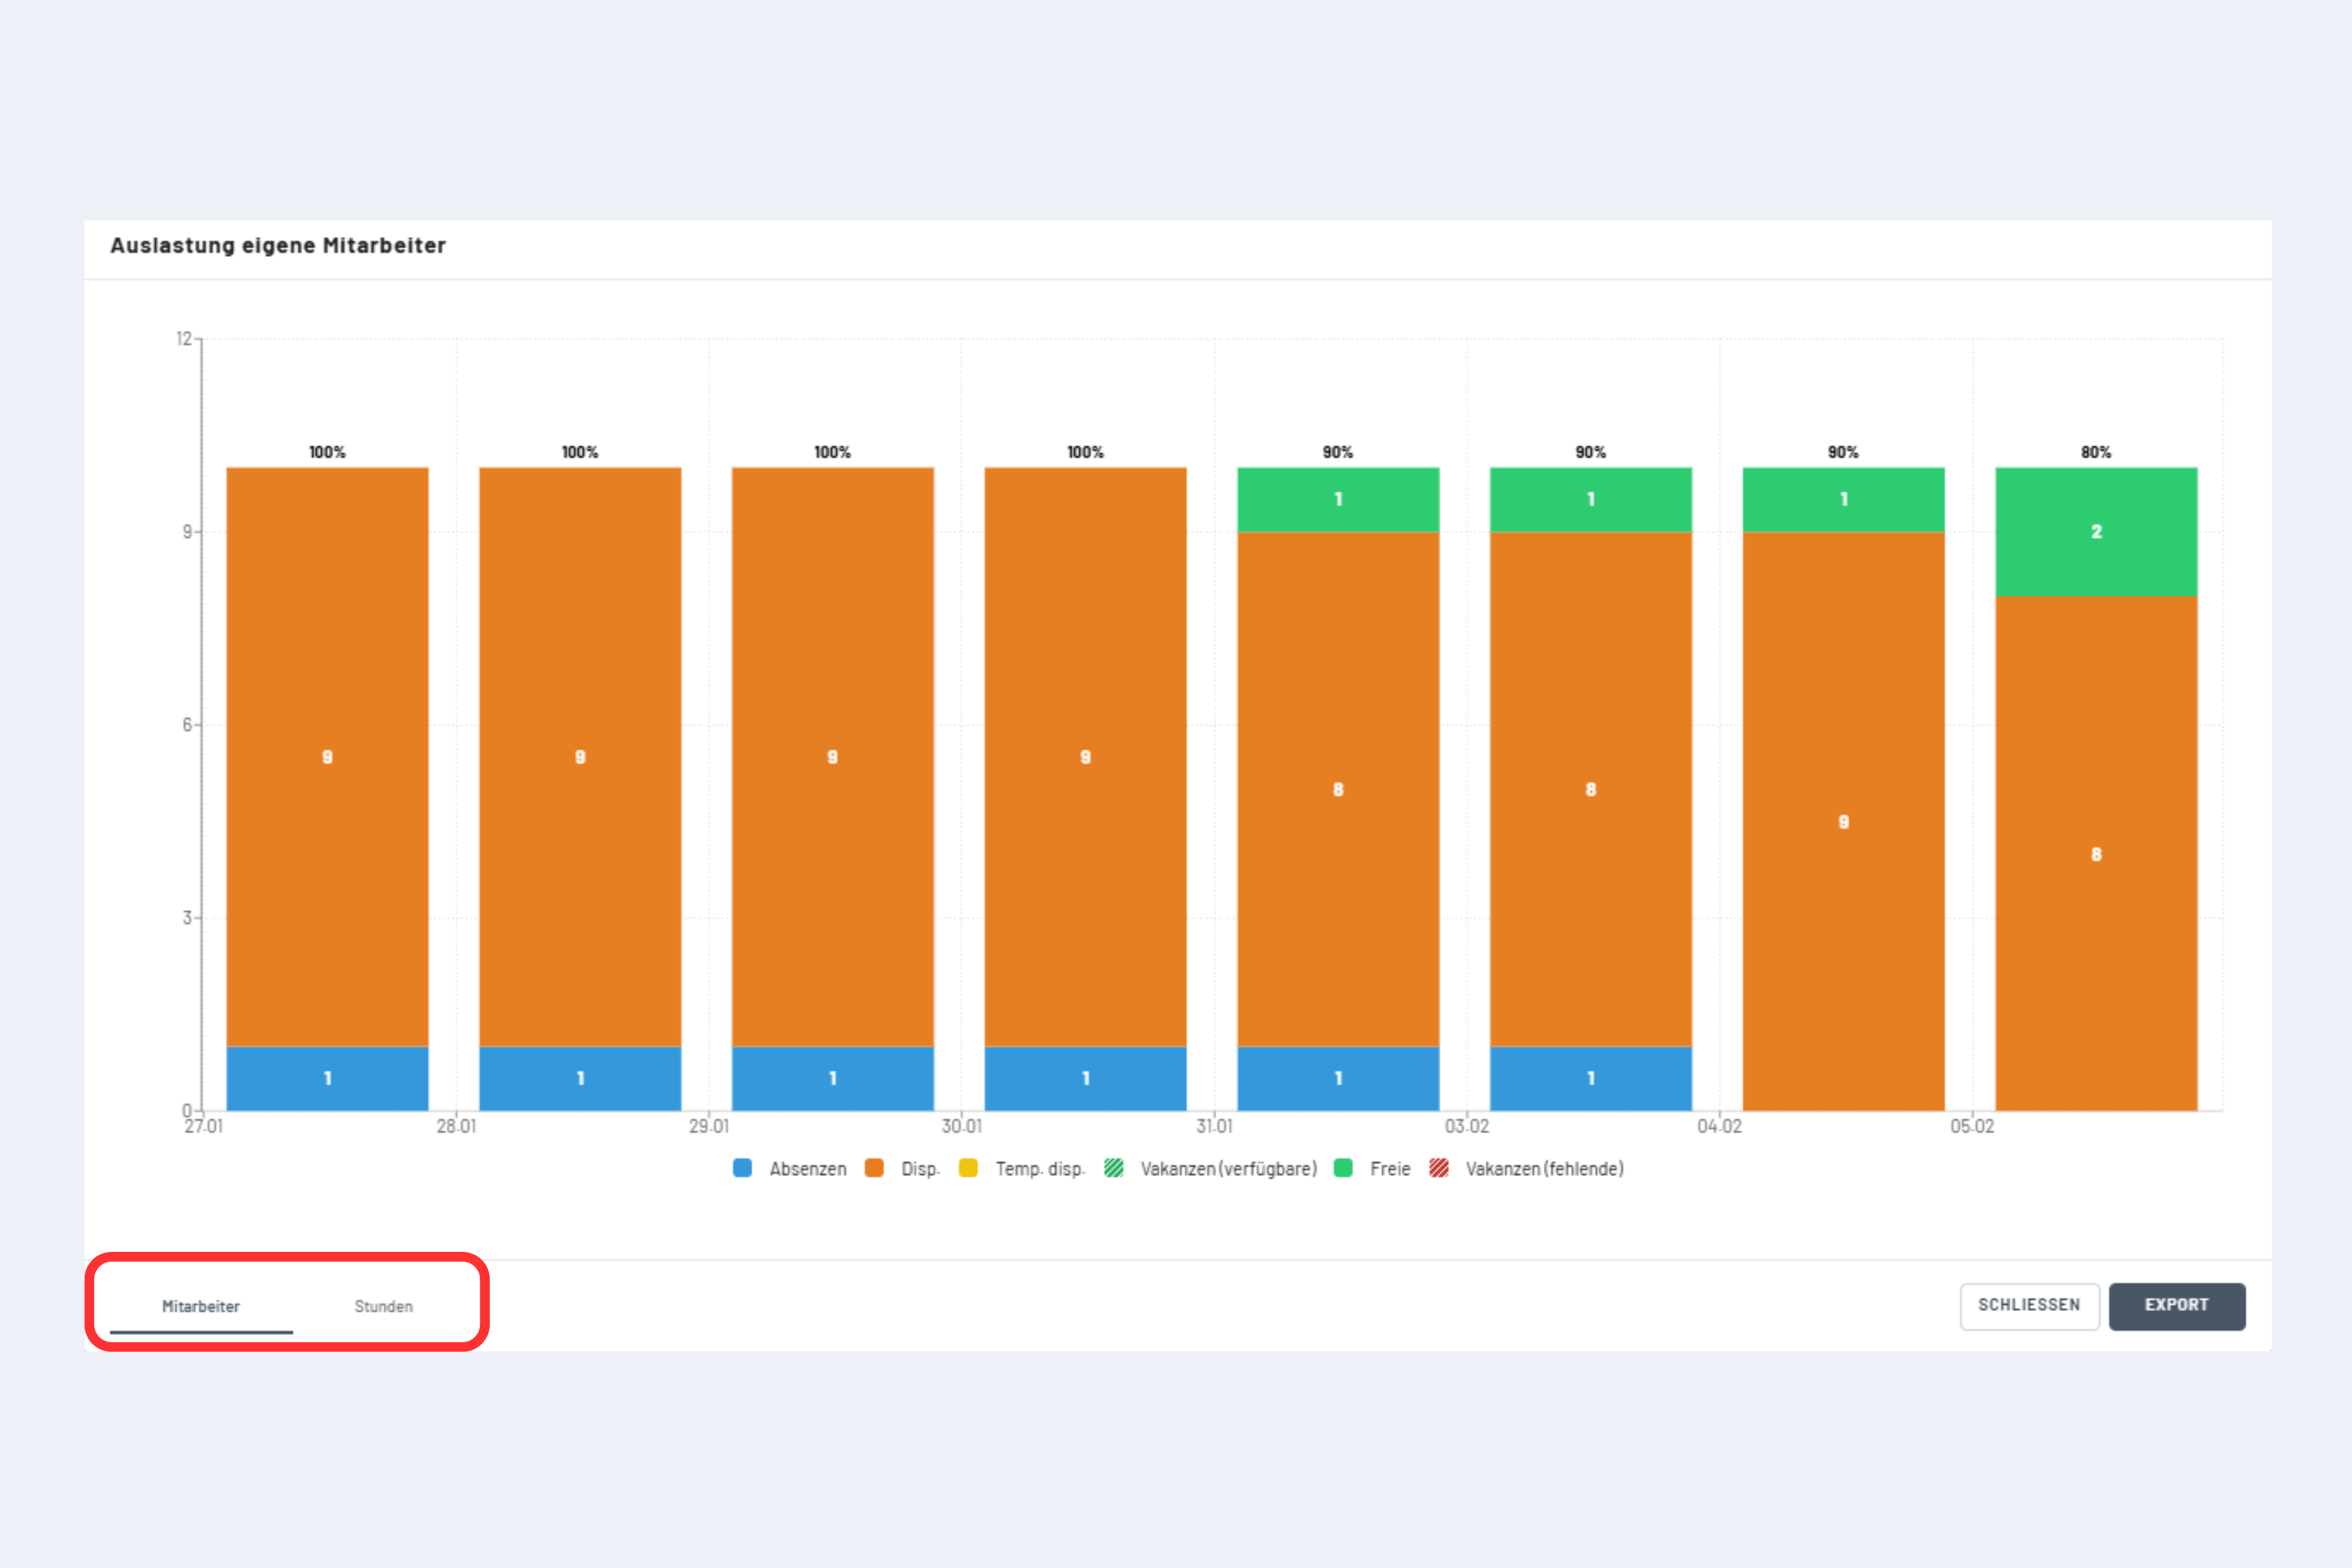
In the lower area of this window, you can choose between displaying in Employees or Hours (see Fig. Utilization Chart Employees or Hours).
Utilization Chart Employees or Hours
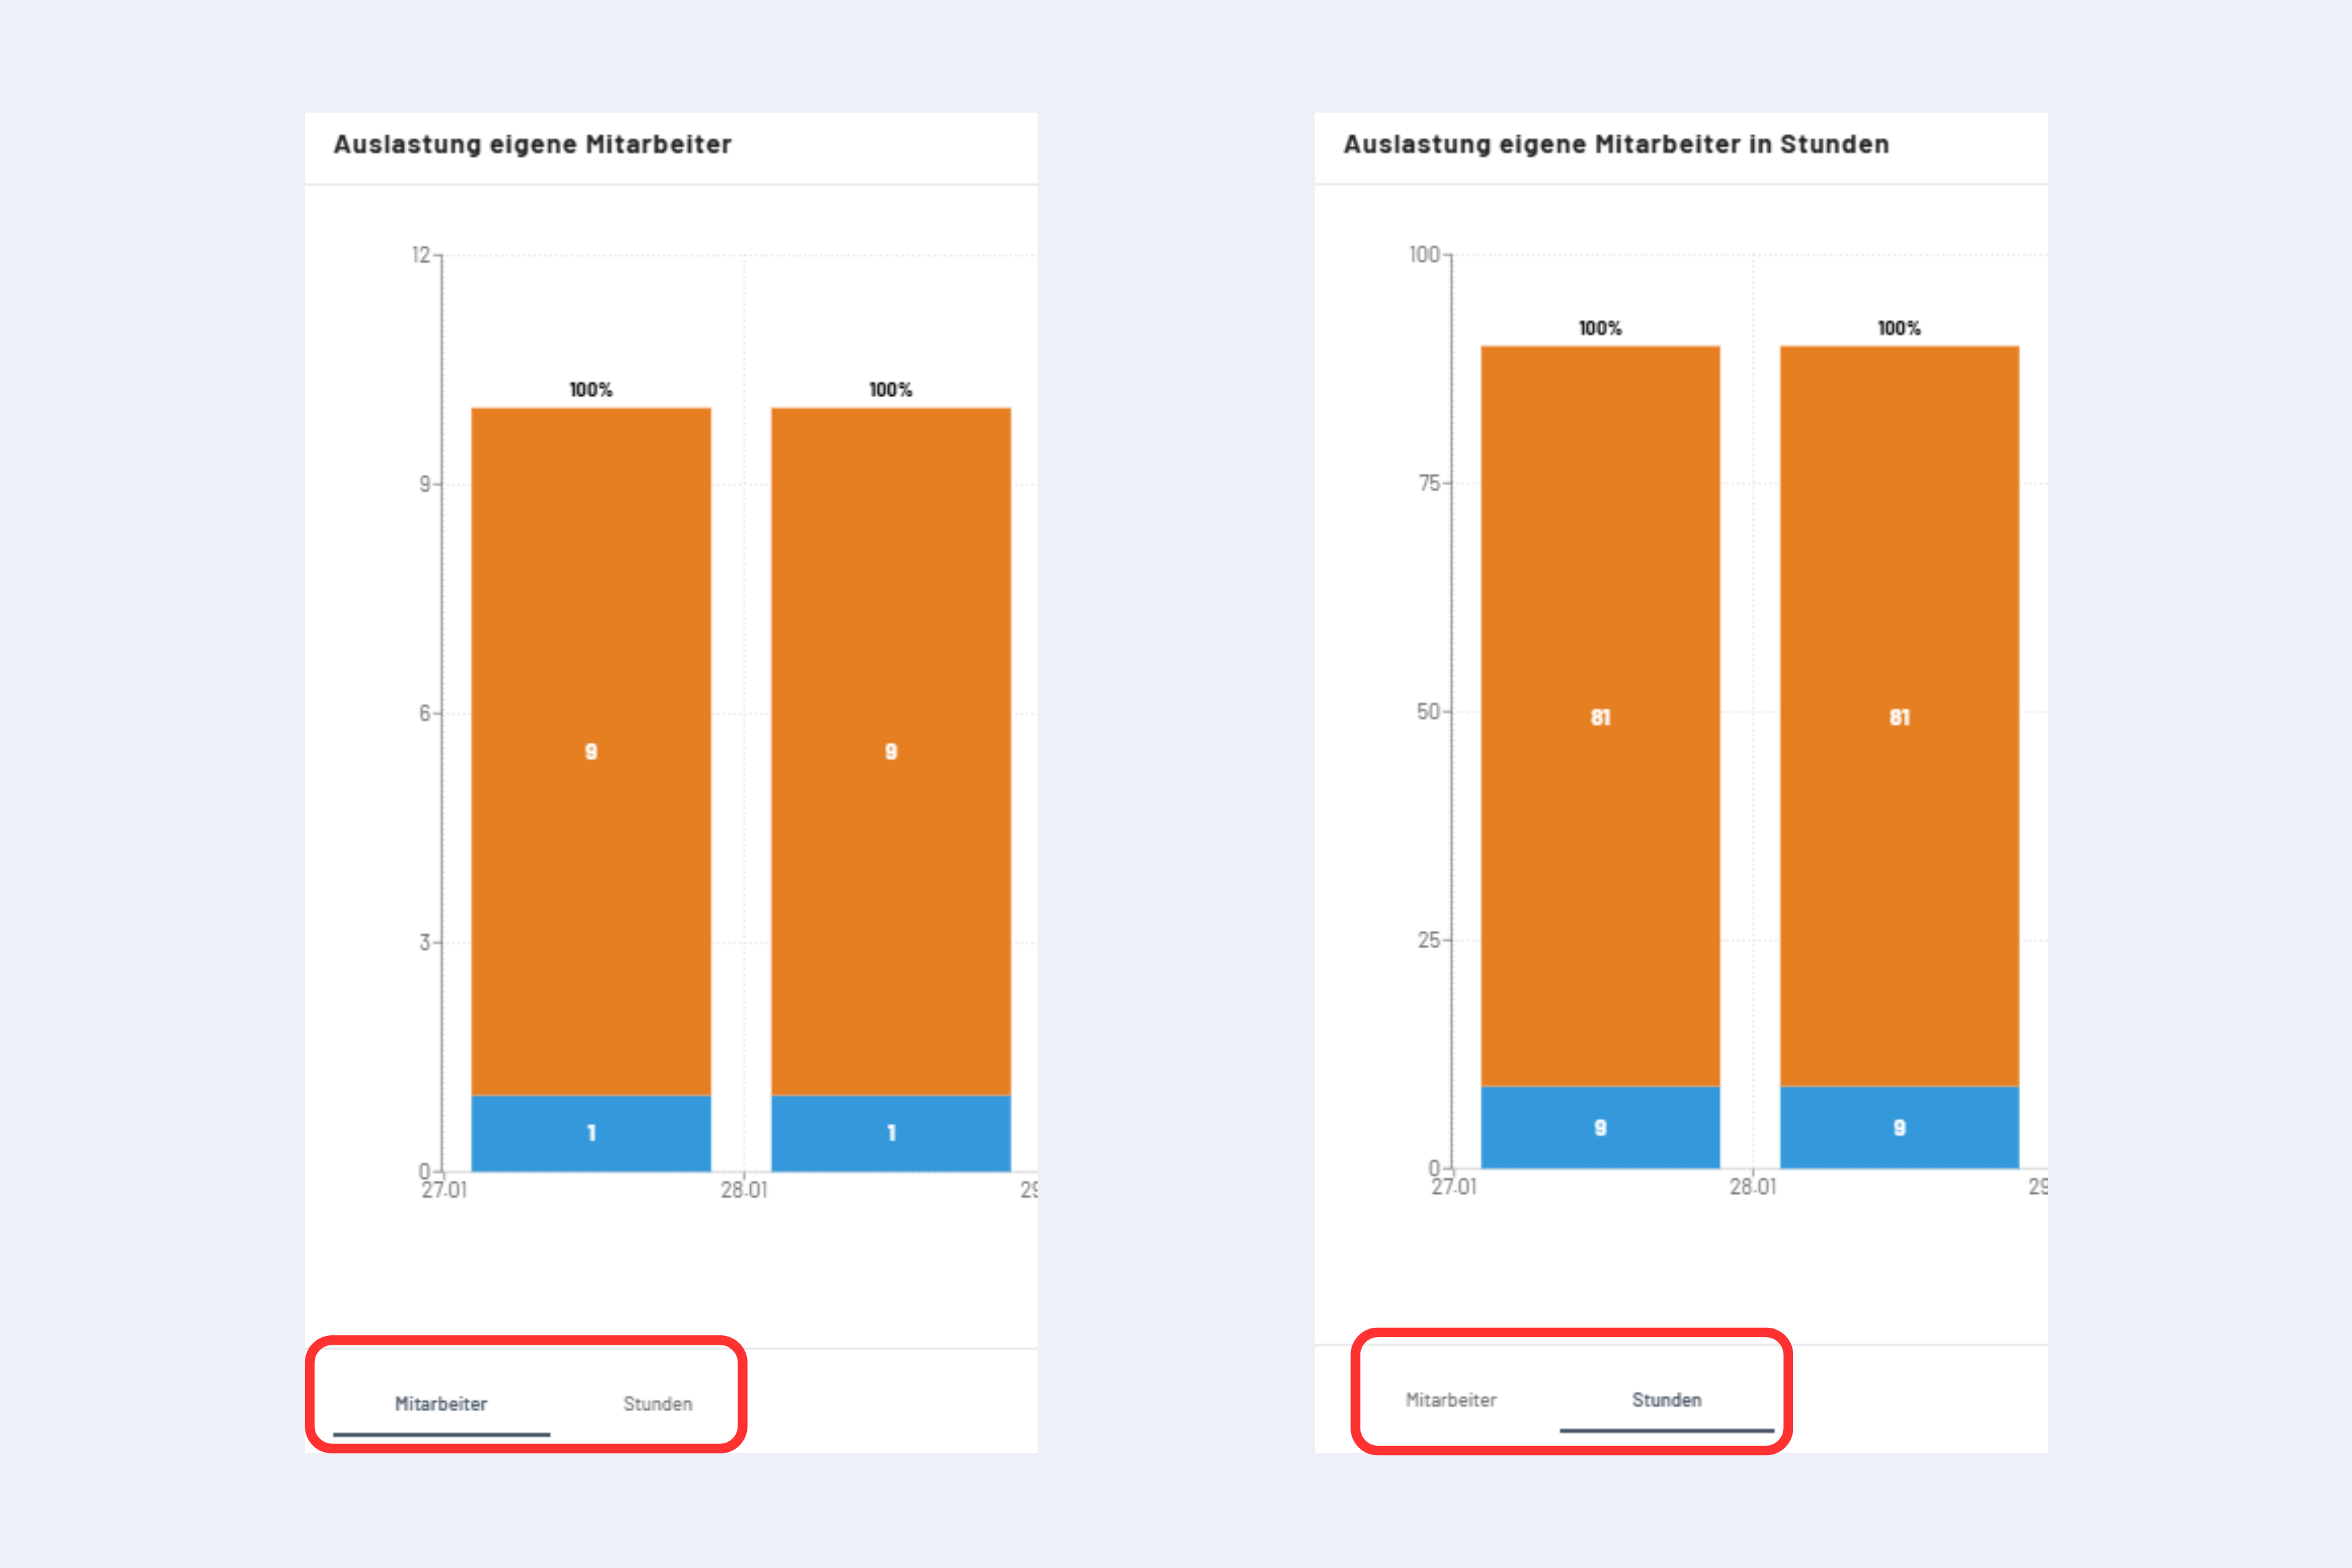
- In Employees
- in this example:
- 9 x Assigned
- 1 x Absence
- in this example:
- In Hours
- in this example:
- 81 hours x Assigned
- 9 hours x Absence
- in this example:
The calculation is based on the stored working hours.
In this example: With a daily target working time of 9 hours and 10 employees, this results in a daily workload of 90 hours at 100% utilization.
The utilization chart can also be downloaded as a PDF by clicking "Export" in the bottom right.